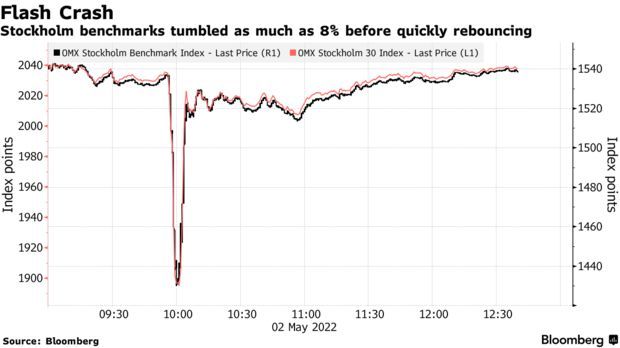
Europe stock Flash crash 2 May 2022
Astrology of the Europe flash crash on May 2 2022

A quickie this time.
This is the chart of a flash crash in European Markets on Monday morning.
From Yahoo finance:
The selloff was triggered by a large erroneous transaction made by the U.S. bank’s London trading desk, …….A knee-jerk selloff in OMX Stockholm 30 Index in five minutes wreaked havoc in bourses stretching from Paris to Warsaw toppling the main European index by as much as 3% and wiping out 300 billion euros ($315 billion) at one point.
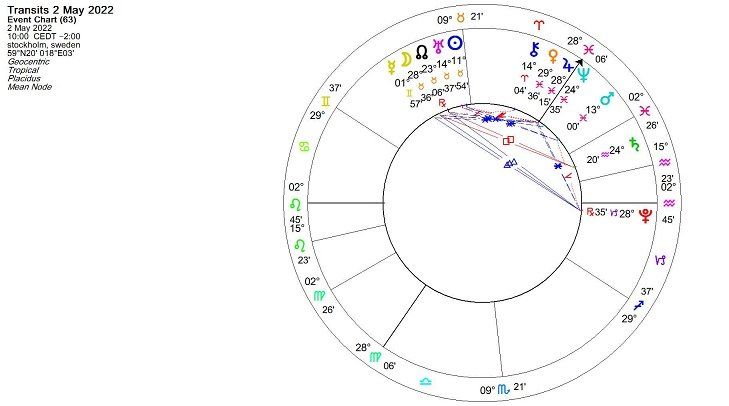
Here is the chart set for Stockholm:

Really this chart speaks for itself. Look at that Jupiter on the Midheaven.
Anyone who thinks that Jupiter is always positive for stocks should go back to the drawing board. Jupiter is big, but big isn’t always good. In this case it appears to have been a big error. Pluto is in sextile to Jupiter, often a sign of big money, and in this case the Moon is also sextile the Jupiter. Usually in a stock chart I would say the latter signified the investors but this is merely an event chart and I think in this case it is referring to the source of the error.
Actually though, despite the grand picture this paints, we can’t ignore the impact of Uranus here either. At 14 Taurus it is in semi-square to Venus. Although what we see is the drama of Jupiter, Pluto and the Moon, our trigger is really Uranus semi-square Venus ( surprise value shocks).
I initially thought that I’d also pull up a chart for London, as that was supposed to be the source of the error, but it wasn’t such a big event in London- especially as the markets were closed for the bank holiday. So the chart is not so useful. Would love a chart for the perpetrator including their astro-cartography though…..!


