Inflation and the markets: a mainly non-astrological perspective
Inflation and the markets: a (mainly) non-astrological perspective
Introduction
I want to diverge from my primary focus this week, because I am interested in the potential outcome over the coming years of the expected increases in inflation, whether they be “transitory” or not.
We don’t need to call in an expert stock market analyst to know that over the last decade, and especially over most of the last 2 years, the markets have risen, well, quite literally exponentially.
Until very recently, nothing seems to dampen the animal spirits. When interest rates fall or quantitative easing increases the markets rise (despite the fact that this is indicating the FED’s concern for the economy) and when the FED says the taper will begin, the markets rise again. The bulls didn’t seem to be able to lose. Until the last few weeks, maybe.
There are plenty of punters that think that the dips are just that and that the market is on an ever upward trajectory. This is especially so of Tech stocks and, by extension, crypto assets. It is interesting to watch the twitter threads- people who have never invested before, believing the hype and not understanding, sometimes even their own investment, but more frequently and more importantly, the bigger picture.
It is logical if you only see part of the picture and conclude that both the asset inflation of the last decades and the general inflation of the coming ones will be leading to a devaluation of fiat, to then deduce that stocks must be a good bet and tech or growth stocks are the best place for your cash.
Similarly it makes sense if you only look at one major facet of fiat currency ( i.e. its infinite expansion towards zero value) to think that an alternative such bitcoin is a sensible option.
However the bigger picture is more nuanced. So I want to look at where we are in the cycles of rates and inflation from an astrological cycle perspective but also from a practical grass roots one.
The astrology
We are aware that with astrology everything runs in cycles. If follows that we need to be aware that we may just be starting a completely new one where the recent past is not a guide to the future, though of course the bigger astrological cycles will be.
I think anyone who knows even the smallest element of non-Sun sign astrology, also knows that 2020-21 was a significant time. With the combined conjunction of Pluto, Saturn and Jupiter in Capricorn we unsurprisingly have had a very “interesting” time. But the conjunctions are only part of the picture.
I’ve mentioned before about the fact that the Pluto/Saturn and Jupiter conjunction , represented the end of a cycle that began in 1981. The fact that this corresponds with the increase in credit/ debt over the last 40 years as well as the reduction in interest rates that accompanied that for around the last 30 of those years, is an indicator that the picture for the next cycles is highly likely to be a different one.
I have also mentioned, more recently in many of my posts, the upcoming Neptune/Jupiter conjunction in late Pisces and how this is likely to be a peak moment in many markets ( though as I have mentioned the exact timing of the peak may not coincide exactly- indeed it is possible that in some markets it has already happened).
Finally there is the third picture that I have referenced a few times now; that of the end of the waning sextiles and trines: the Neptune/Pluto sextile , the Pluto/Uranus trine and the Uranus Neptune Sextile. With these currently being accentuated by Pluto Saturn and Pluto Jupiter sextiles ( the latter ending around when Jupiter reaches Neptune), we have never had it so good. So the chances are “things” are going to catch up with us.
But what exactly are the problems that we have been naively building over the previous decades and what could wrong?
The background
This is not going to be a technical economic paper- I want it to be accessible, so it won’t deal with every permutation and theory and there won’t be any calculus. The purpose is to outline the broad themes and how they could play out if the portents of the coming astrological cycles are to be fulfilled as I expect.
I’ve already mentioned debt/credit and interest rates. But they are only part of the picture, after all it’s been ok so far hasn’t it? And even if things get worse countries such as the US are surely very well placed to survive; aren’t they?
Well yes, things have been mainly OK, but that is because some elements of the environment have been obscuring others. For a start, globalisation has been a huge factor in the consumption of the west over the last 40 years. I recall buying a skirt when I was about 13 and noting it was cheap for what it was. Yet, it would cost much the same today because production of such items have been outsourced to cheaper countries.
Everyone from the very poor to the very rich has benefited from this shift. People have been able to but more occasional items and luxuries because the basics have got cheaper.
But that is not the whole picture. Since 1981 there has also been a huge increases in personal credit. Not to mention government borrowings. Costs have been deferred to later and even the next generation.
And just when it looked like the chickens were coming home to roost on the size of the credit balances, Quantitative easing and other measures designed to prevent recession after 2008 and beyond including during the pandemic have contributed to an ongoing sense of ease for most people.
But it has also contributed to a polarisation of wealth. We know, that the last few years have exacerbated these trends, for example the top billionaires saw their wealth double in the last year or so, which hardly suggest that the trends of the last couple of decades are reversing or even stabilising.
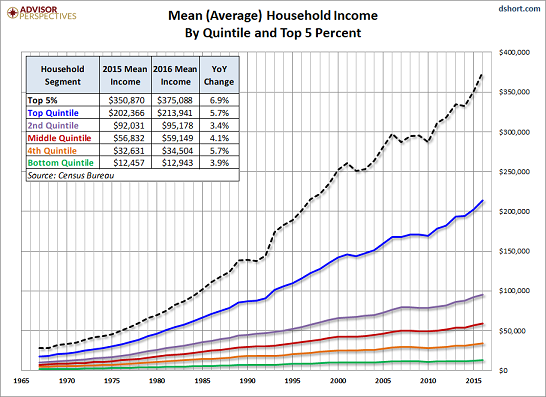
I don’t have access to sufficient data to look at the details of the UK or even of the US in more recent years but we can get an idea by looking at some of the data from 2012-13 similar to that used by Piketty in his Capital in the 21st Century.
First we can look at the income by quintile for the period 1965 to 2015. It is pretty clear from this that since the 1980s there has been a huge divergence in income growth between rich and poor

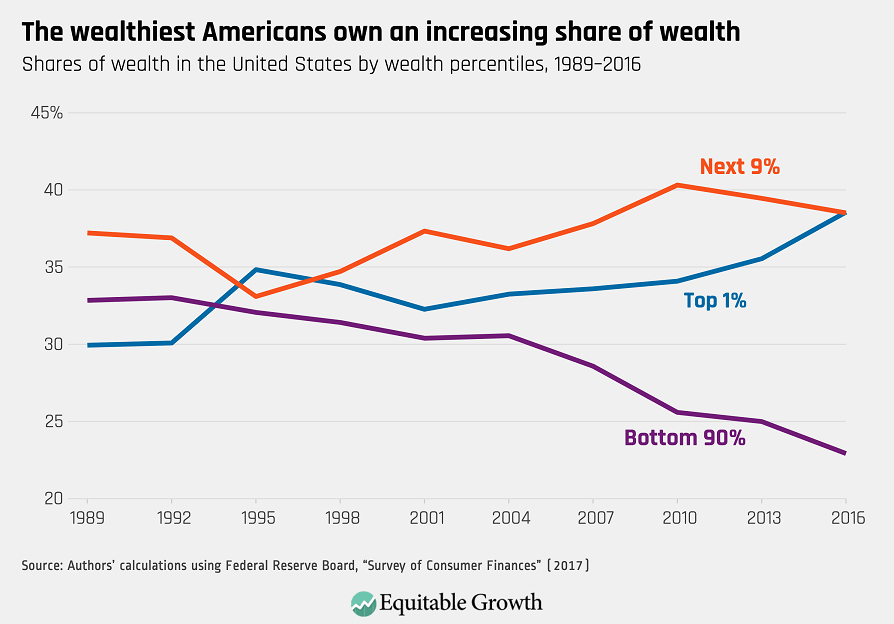
But income is only part of the picture. We need to give an indication of the trends in wealth too. While income can party be a proxy for that it is not the whole picture.
The data is less easy to come by but at least we can see the picture for the top 10th and bottom 90th. It is not reassuring.

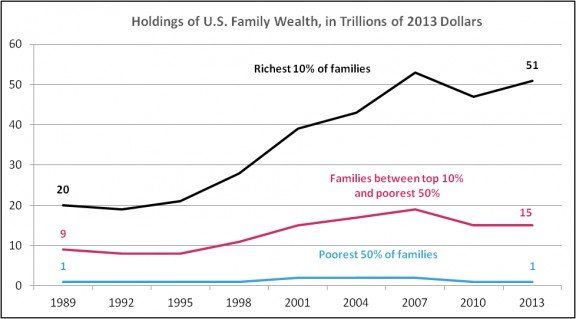
Here is similar information put into absolute terms.

What is particularly frightening about this is tthat for the bottom 60% there has been little increase in Nominal wealth over 40 years despite gradual income inflation and massive asset inflation.
Finally we have an even more interesting graph. This one is for a 100 years. While the graph title focusses on the possibility that we are about to repeat 1929 and the 1930s, I am more interested in how it parallels the astrology. The flat section from the 40s to the 1960s shows us the period when Pluto and Neptune were sextile before the Pluto Uranus conjunction. That triggers an even more equal position for a short while. But by the early 80s we are on an upwards trend that hardly stops for a breather other than in 2000-1 in its relentless transfer of wealth to the very rich.

But, while that all says a lot about the impact of easy money on the overall value of assets, and perhaps what happens when you lower interest rates over time ( though I am sure others would argue that with me), it doesn’t really say anything much about general inflation.
And, obviously, it is a summary of the past and says nothing about the future or as they say ( correctly in the sense they are using it though incorrectly if we are talking astrology) “ past performance is not a reliable indicator of future performance”.
What it does tell us is that the ability of different economic groups within the population to face changes to their financial position is noticeably different from 40 years ago. Cheap debt and low general inflation due to globalisation has for the most part prevented this becoming a critical problem until now. However the large pool of the relatively poor have little if any slack in their budgets and that pool of poor people is relatively larger than the one that existed in 1980.
With that in mind it is time we face the monster.
The likely trajectory- the journey begins
I want to leave aside true hyperinflation for the moment, as I don’t think countries such as US, UK and Western Europe are likely to see that in the immediate future- though by 2060 all bets will be off. I prefer to look at the impact of moderately significant inflation which I consider much more likely.
The problem is we do not know for any given company just how the mix of income inflation and cost inflation will play out. This is why we cannot necessarily relax about tech shares for example.
At a macroeconomic level we have companies, labour and consumers ( and of course public sector activity). In theory a company may have the same people as its labour, its consumers and its shareholders. In practice, while there is some overlap between the sets, there is plenty that is outside one or more groups. Then, other than labour, inputs will include natural resources, land and purchased materials (made by other companies labour either locally or elsewhere).
Obviously depending on how relative inflation changes the exact picture will be complex. So it is helpful, even when not using mathematics, to use the convention of taking the extreme case first to demonstrate the bounds of the problem.
The simple case- one direction
So let’s start with a simple (albeit wholly unrealistic position); Everyone’s wages increase at exactly the same rate as every single wholesale and consumer price. In this case although the nominal cost/price of everything increases the relative costs don’t – everyone can afford to buy exactly the same mix of products/labour/resources as they did before. Great. In this case holding assets across the board is an advantage and holding fiat most definitely is not.
In this simplistic model, the only thing that changes for the company and individuals is the relative cost of debt service. The amount of nominal debt (and even in many cases the interest rate) is fixed in the past. The relative importance of the debt decreases as inflation increases. The debtors become relatively less well- off and the creditors become relatively better off. Great if you owe money (as do many governments) less good if you are owed it.
However, even in this simple case, there are complications. Suppose you are a government with a public sector pension fund which holds debt instruments. Will you be better off or worse off due to inflation? Without exact numbers it is impossible to say.
So, if it’s impossible to say in the simplest cases, imagine what happens when things get a little or a lot more complex!
Introducing a split in the route
Now then, let’s get to the meat of the issue. In this case suppose (due for example to natural resource/harvests/foreign trade disruptions) prices of inputs in an industry go up more than labour costs – If this happens consumers are squeezed.
But, what if this happens across the board.
Let us look at a selection of products and what may happen if prices rise significantly

Let’s look at what that might look like for an individual. If for example their salary goes up due to inflation by 10% ( and taxes and housing follow suit) but companies across the board increase their prices in line with other inputs by 20% and the consumers’ potential expenditure would rise by 20% then what would happen would look like this:

In this typical illustration, percentage expenditure in the occasional or luxury groups, which incidentally includes much of consumer tech, falls.
In this case what the company sees is reduced demand. It doesn’t look like much on the diagram but it is 50% of demand in those categories. Reduced demand is less units sold and so less profit on the bottom line.
Suppose, on the other hand, companies across the board allow the inputs to rise without increasing prices. Demand for units may will remain the same rise but in most cases the net impact will be lower margins and profits.
Either way, pain to the consumer will feed through to the majority of companies. Companies with big overheads will fail as will companies that make the wrong choices or get behind in rising prices.
In practice, tech for example is a mainly people business. But this does not protect it from the substitution away from occasional and luxury towards essentials, only from the increased inputs other than labour.
There is no escape. No automatic silver lining for the stock market once the cycle begins to unfold.
Ever more complex route decisions
However this is not the full picture. Other options are available. Maybe wage inflation will increase more than other inputs? Maybe companies can increase their prices accordingly? That sounds promising.
But it is unlikely. We have, as mentioned, reached the end of that cycle and globalisation is no longer the route to cheaper and cheaper (even in real terms).
Then we have the other variable: debt and interest rates. There is no reason to think that the demand for debt (consumer or government) will decrease noticeably in the near future. Rates going up will have the same impact as input prices on consumers’ disposable incomes. Heaven knows what will happen to governments. (Only significant inflation to erode the debt faster than the interest needs to be serviced can really see them out of their holes).
For example while general inflation will lead to a bigger tax take all other things being equal, it will take balancing to get that tax take to cover the inflation in labour costs. Add to that the pressure to raise interest rates ( interest being added to any deficit) and there is a risk that net debt will rise not fall despite the inflation.
Given that it has done so consistently in the good times it is a stretch to think it is going to evaporate in a few years in the less stable ones.
The answer of course to all these examples is “it depends”. It depends on the mix of labour vs resource inflation. It depends on the cost structure of an individual company. It depends on to what extent people can access cheaper foodstuffs or alternatives to heating. It depends, it depends, it depends…..
There are plenty of people whose job is to model these things day in day out so let’s not try to do their jobs.
The only thing we can know for sure is that things will change and we cannot assume that simple extrapolation will give us an answer and is highly unlikely to give is the answer we were secretly hoping for.
Conclusions
The astrology suggests we have reached, or are reaching the end of a number of long term cycles and the environment of low inflation due to globalisation, increasing debt coupled with reducing rates and loose money inflating asset prices is coming to an end.
We see over the next decade the picture radically changing to one where the majority (excepting the top 10%) have far less discretionary expenditure and envisage that this will flow through into corporate profits and thus share prices. Indeed we can’t be sure that inflation will be the end result as ultimately the problem might just be lack of demand i.e recession even though medium term inflation may take us to that point.
However, we do not see lower interest rates continuing, (though at first rises will be slow they may have to accelerate in later decades), and this will further pressurise individuals, not to mention governments. That too will feed through into asset prices including eventually even property.
Enjoy spending your money now. Or put it on the horses. You might as well.


